Use Cases
If you’re not sure where to begin, below should provide some useful ideas on where to start, and how to grow over time.
Simple starting points that deliver quick wins
Pick one practical use case from one of the challenges your business is currently experiencing. Get your dashboard set up, embed its use into the daily routine of the business and watch the results happen.
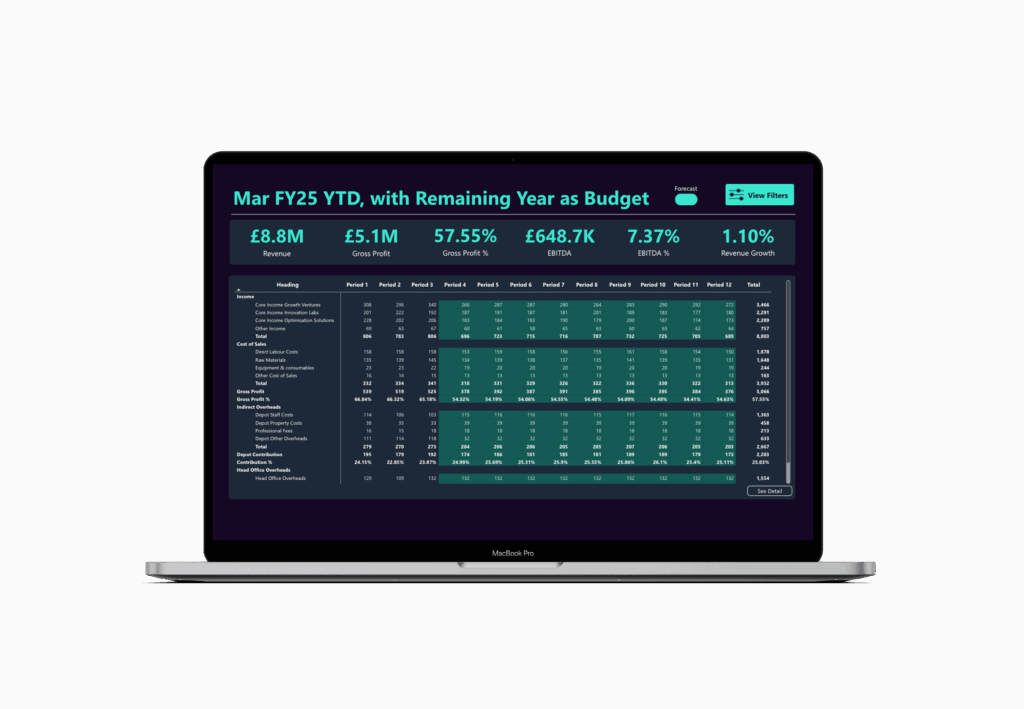
Automated, interactive monthly reporting
Instead of manually producing spreadsheets to show your monthly P&L, balance sheet and creditors / debtors, automate these and provide an interactive experience. Now when someone asks why a number has changed, you can just click through to the detail.
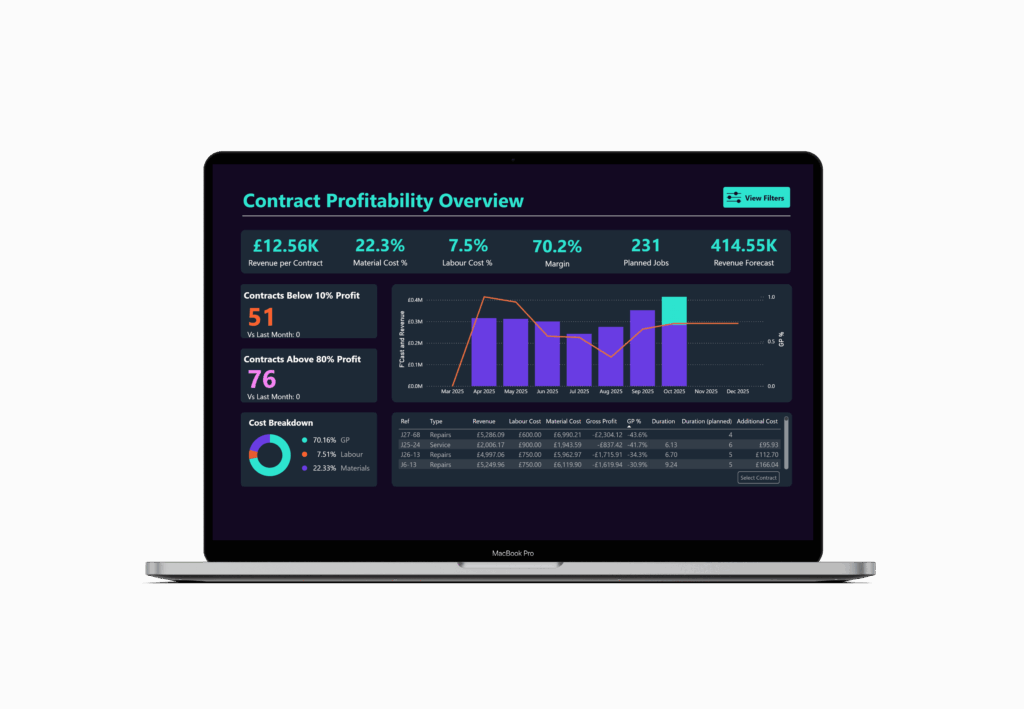
Measure performance on a critical project
If you’ve got a key client or contract which is critical to your business, create a dashboard for that project. Use leading indicators such as response times, SLA compliance and productivity, as well as revenue and cost as you progress, ensuring no surprises at the end.
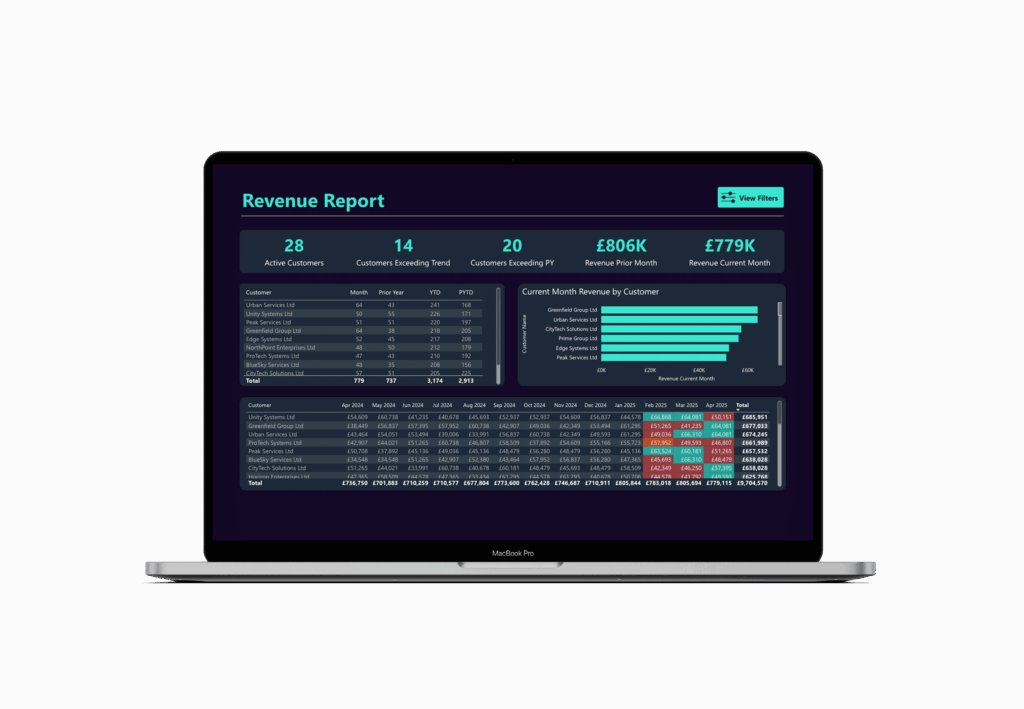
Forecast your revenue
In your business, there will be some activity or productivity you can measure which will help you forecast revenue before you make a sale or raise an invoice. By combining that activity data with some key assumptions, you can get early predictions on whether things are going well or not.
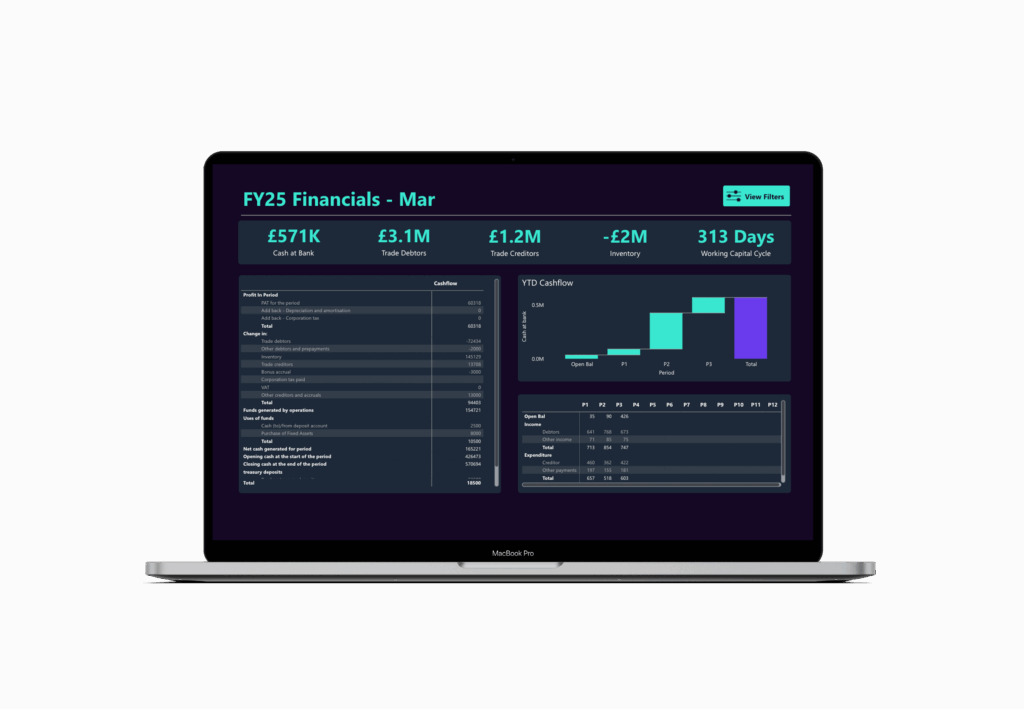
Automate cashflow forecasting
Automate your daily, weekly or monthly cashflow forecast spreadsheet. Pull in data on activity to forecast invoicing, use invoice data and due dates to predict receipts, use purchase orders or invoices received, along with regular payments, such a VAT, payroll and PAYE or subscriptions to forecast payments out. Spot problems early.
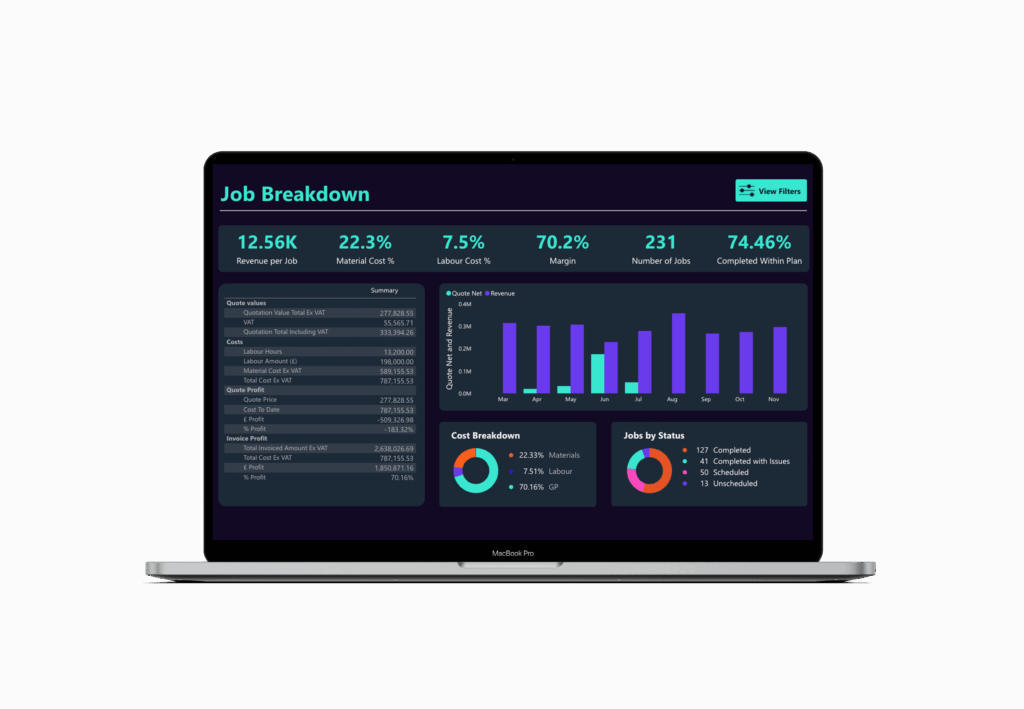
Track profit leakage
You already know there are things happening in your business which hit profits, so start tracking them. It might be rework, write-offs, discounts, scope creep or just a simple failure to invoice. You may not need to sell more to hit 10% growth, just make sure that you improve in these areas and get paid more for the same or less work.
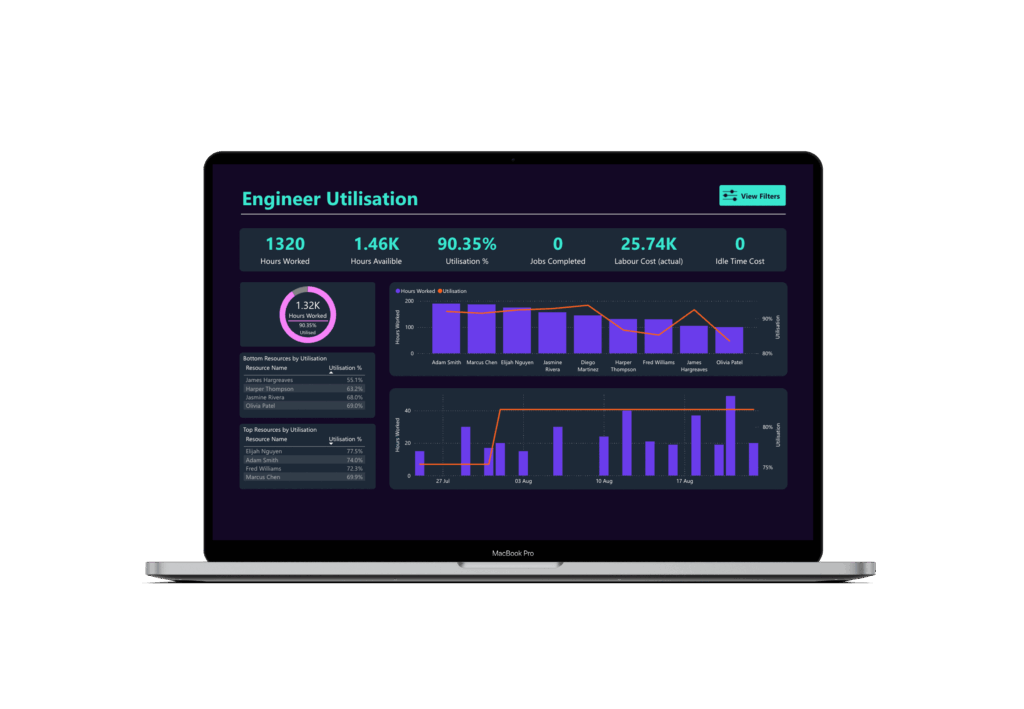
Track utilisation and capacity
This is relevant in all businesses, but critical in those that sell time in any way. Your single biggest driver of revenue and profitability is how effective you are at maximising your use of resources, which could be people or equipment. Use timesheet and equipment usage data to get daily visibility and predict margin problems.
How we make this easy
No new systems: we connect with what you already use, even spreadsheets.
Fast implementation: your first dashboards within 6 weeks, or your first month is free.
Clear visualisations: dashboards designed to be simple to read and easy for both your team and your board to understand.
Grows with you: start with one case, add more over time.
Contact us
Email hello@vizora.com
Call on 01473 355810