Real-time job profitability dashboards for BigChange users
We’ve built three dashboards that our BigChange users are finding incredibly valuable. They’re gaining instant visibility into which jobs are profitable and which aren’t – without manually updating spreadsheets.
The challenge most BigChange users face
BigChange excels at operational management – tracking jobs, logging time, managing invoices. It’s brilliant at what it does.
But many users tell us they struggle to get clear answers to profitability questions: Which job types are most profitable? Which clients and contracts are worth the effort? Are we getting more or less profitable over time?
BigChange’s native reporting gives you some of this information, but it often requires manual work to get the full picture. Many businesses we speak to are still exporting data to Excel and spending hours each week trying to piece together profitability insights, especially where their cost data isn’t in BigChange.
By the time you spot a problem in your monthly reports, you’ve potentially already lost money on multiple jobs. And without clear patterns, it’s difficult to know what to change going forward.
Vizora’s job profitability dashboards are the product of working with a range of field services businesses using BigChange and are designed to deliver the numbers they need, in the way they need them.
What we’ve built for BigChange users
Vizora has developed three dashboards that connect directly to your BigChange data and provide real-time profitability visibility. These standard dashboards can be quickly connected to your data using your BigChange API and you’ll be up and running in no time.
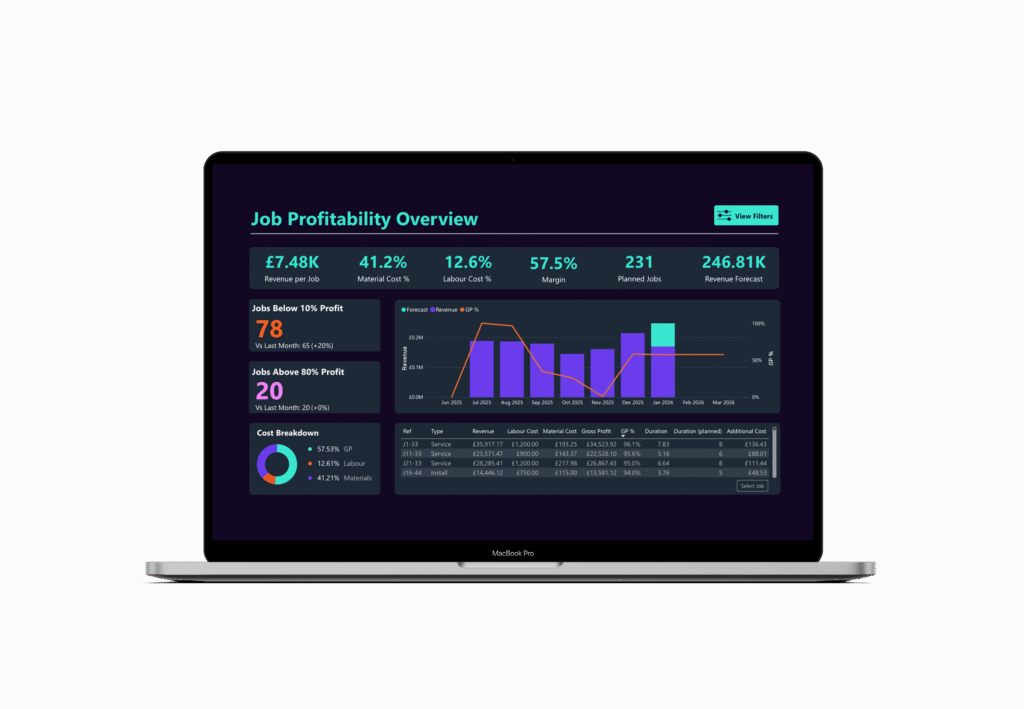
Dashboard 1: Job Profitability Overview
This dashboard displays every completed job with its actual margin, updated automatically as data flows in from BigChange. You can sort and filter by client, job type, engineer, or date range – helping you quickly identify patterns in your most and least profitable work.
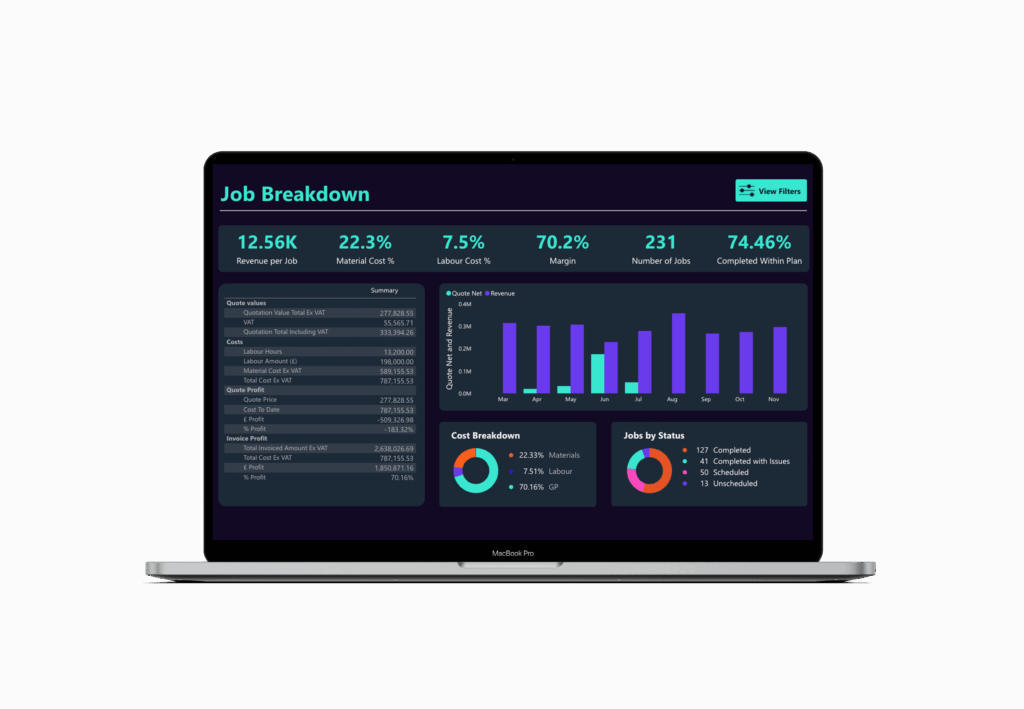
Dashboard 2: Profitable v Unprofitable analysis
This view helps you understand not just which jobs made or lost money, but why. You can spot patterns across job types, clients, or service offerings – making it much easier to make informed decisions about pricing, resource allocation, and which work to pursue.

Dashboard 3: Profitability trends
Track how your profitability is changing over time – by month, quarter, or year. View trends by client, service type, or any dimension that matters to your business. This helps you see whether the changes you’re making are actually improving margins.
What other BigChange users are experiencing
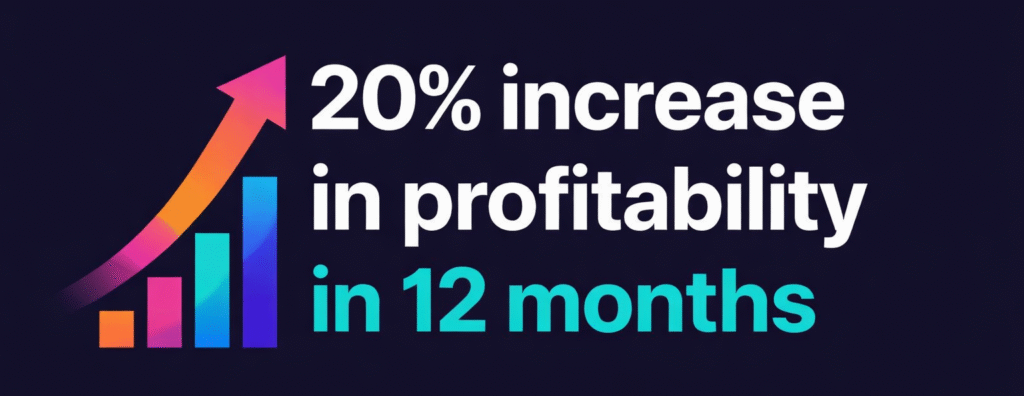
Nirvana Maintenance implemented these dashboards and saw their profitability increase by 20% over the following year.
Read the full Nirvana Maintenance case study
The dashboards helped them quickly identify jobs running at low margins, or at a loss. With this visibility, they were able to reprice certain services, stop taking on work that would not be profitable, and focus their resources on the jobs that generated the best margins.
The common theme the Vizora team hear is that the instinct of BigChange clients isn’t always right on which jobs and contracts are performing well, and which ones are not. Having this clarity makes business decisions significantly easier.
How we make this easy
No new systems: we connect with what you already use, even spreadsheets.
Fast implementation: your first dashboards within 6 weeks, or your first month is free.
Clear visualisations: dashboards designed to be simple to read and easy for both your team and your board to understand.
Grows with you: start with one case, add more over time.
Contact us
Email hello@vizora.com
Call on 01473 355810
Questions we often hear
“We’re already using BigChange’s reporting features”
That’s great – BigChange’s reporting is useful for many things. These dashboards are designed to complement what BigChange offers, not replace it. They’re specifically built to answer profitability questions in ways that BigChange’s standard reports don’t cover. Many of our clients use both.
“We have our own spreadsheet system that works”
If your spreadsheets are giving you the insights you need without too much manual effort, that’s excellent. The main difference here is that these dashboards update automatically as jobs complete in BigChange – there’s no data export or manual updating required. For most businesses, this saves several hours each week and reduces the risk of working with outdated information.
“What does this cost?”
The investment varies depending on your specific requirements, but to give you context: Nirvana Maintenance added 20% to their profitability within 12 months. Even a fraction of that improvement typically provides a very strong return. We’re happy to discuss specific pricing during the demo based on what you’d need.
“We don’t have capacity for a big implementation project right now”
That’s understandable – we’ve designed the process to minimise the burden on your team. We handle the technical setup and dashboard configuration. What we need from you is access to your BigChange account and some time to discuss what matters most to your business. The actual implementation typically takes less than six weeks from our side, with minimal involvement required from you.
See if these dashboards would work for your business
You’re already capturing all the data you need in BigChange – every job, every hour logged, every invoice sent.
These dashboards simply help you understand what that data is telling you about profitability, in real-time, without the spreadsheet work.
We think they could be really valuable for you, given what we’re seeing other BigChange users achieve with them.
Book a demo and we’ll show you exactly how they work. No obligation – just a clear view of what’s possible.