Job Profitability for Field Services
If you’re a field service business managing hundreds of jobs a month using BigChange, enhance your insight into which ones are performing
Go beyond native reporting
In our experience, job or project management software such as BigChange is brilliant at helping you manage the day to day processes of getting jobs done, and gives you a degree of insight into profitability. However, it can lack the ability to give you the detailed picture or the flexibility to produce reports how you want to see them. This is particularly the case if you need to bring in cost data from elsewhere, such as the cost of your people (including on-cost, such as Employers NIC, pension etc).
Vizora’s range of job profitability dashboards are the product of working with a range of field services businesses using BigChange and are designed to deliver the numbers they need, in the way they need them.
Our design philosophy is simple: provide an initial overview, so that at a glance you can see what’s going well, and what isn’t, and give you the ability to dig deeper if you need to.
If all is going well, you don’t need to look any further. If something is off, the dashboards allow you to delve into the detail to understand the problem, and determine what is needed to fix it.
Job Profitability Overview Dashboard
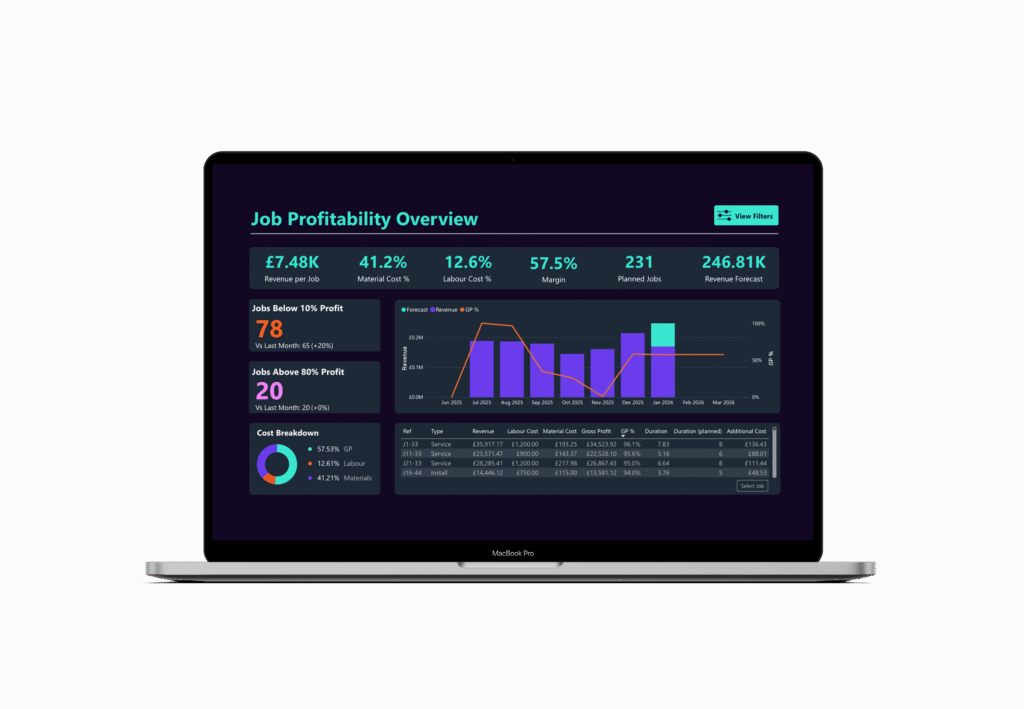
The quick overview
In this dashboard, you can see all your key numbers at a glance, across all jobs. We’ve also added in a revenue forecast, so you can see how this month is panning out. You can select any period, and see your key figures, such as revenue, material cost and labour cost. You can preset your filter so it shows this week, this month, or this year, by default.
To help you spot issues, we’ve added in widgets to show the worst and best performing jobs – which you can customise to thresholds that work for you.
As ever, you can quickly filter the data (by client or date, for example) and click through to see more detail.
Job Commercial Summary Dashboard

The commercial view
This commercial summary dashboard gives some additional detail beyond the overview dashboard, if that’s how you prefer to see your information. Depending on how your data is set up in BigChange, you can both view both individual jobs and by job group. Once again, you can aggregate these further and view by project, contract or client – depending on how you have your data set up.
It gives you key metrics on labour hours and cost, purchase order values and purchase costs, giving you a clear picture of how your costs are building up, and how they are impacting profitability.
The Job Timeline gives you an at a glance view of how revenue and costs are moving over time.
Job Breakdown Dashboard
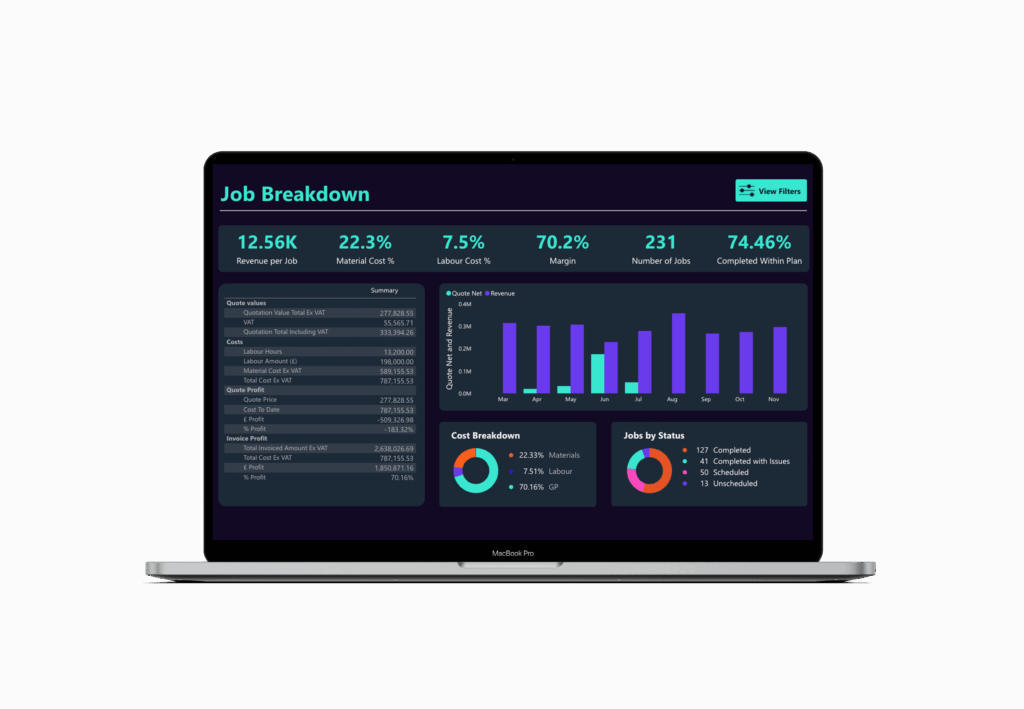
The swiss-army knife view
If you like to slice and dice your data different ways, this dashboard is for you. You can use it as a quick overview, or you can get in to the detail. Using the the filters, you can review job profitability by day, week, month or year, but if that’s still not granular enough for you, you can filter down into individual jobs to see their specific detail.
If you invoice from quotes, this will give you an clear overview of how the job evolved from quote to invoice. You can quickly see how well you have managed changes in scope and ensured your are invoicing for extra work completed.
In our experience, capturing and monitoring this scope creep is a key challenge for field services to protect margin and drive improved profitability. Nirvana Maintenance used this dashboard and custom alerts to drive a 20% increase in profitability in 12 months.
How we make this easy
No new systems: we connect with what you already use, even spreadsheets.
Fast implementation: your first dashboards within 6 weeks, or your first month is free.
Clear visualisations: dashboards designed to be simple to read and easy for both your team and your board to understand.
Grows with you: start with one case, add more over time.
Contact us
Email hello@vizora.com
Call on 01473 355810