OPERATIONS LEADERS
Clarity and control for day to day performance
We help busy operations teams stay on top of service and margin performance with live dashboards
Your outsourced reporting team
Vizora acts as your outsourced BI team, connecting operational activity to outcomes that matter: revenue, profit and customer satisfaction.
Operations leaders in SMEs are juggling people, projects and service delivery every day. Our powerful dashboards give you the data to know what’s on track, what’s slipping and what to fix, before it starts hitting profits.
Reporting challenges for operations directors

Teams say they are busy but output doesn’t match effort.

Software tells you what you’ve done but not if you’ve made money.

You don’t get notified when time is lost of additional cost incurred.

You’re spending hours manually updating spreadsheets to measure KPIs.
Use activity to predict future performance
Vizora gives you leading indicators today, to help you predict as you go. Operations can now see problems building before they create customer issues or impact financial performance.
| Activity you can measure | Outcomes you can predict |
| Operational activity per day / week | Turnover for the month |
| Team capacity and utilisation % | Contribution to profit |
| Customer satisfaction score | Repeat business and customer retention |
| Rework and delays | Profit reduction |
| Delivery cycle times (delivery, response, project length) | Service level performance |
| WIP to invoice time plus debtor days | Cashflow and cash pinch-points |
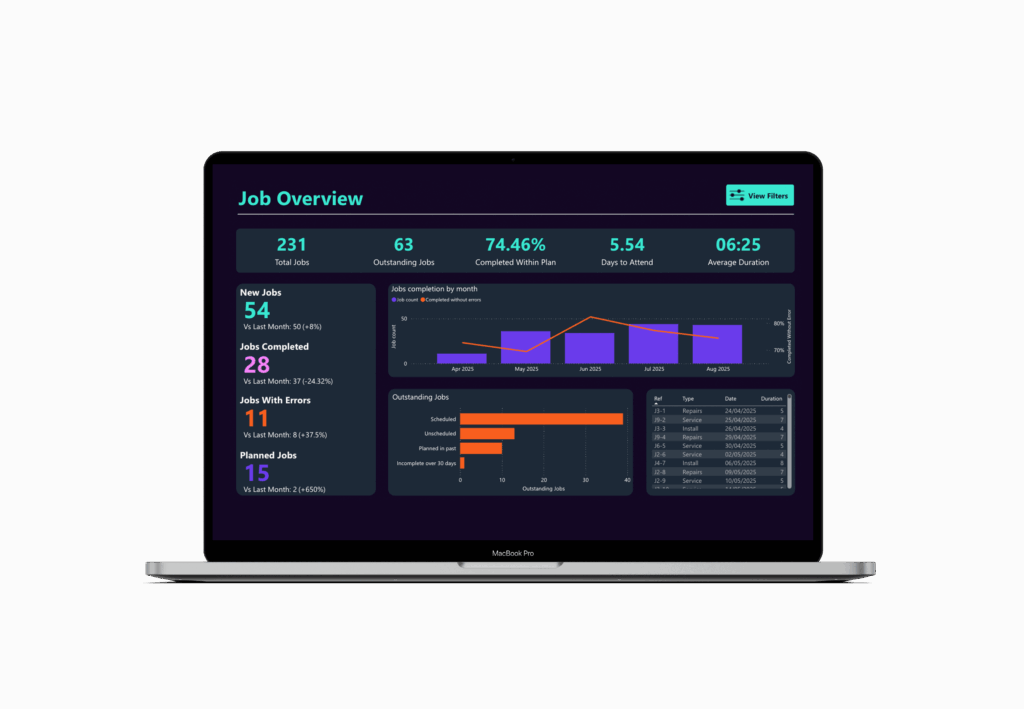
Operations dashboards with intuitive visuals

Individual and team utilisation as a percentage of capacity
High level overview of projects, including business specific KPIs such as response and completion times
Individual project analysis with revenue, cost and drill through detail on resources
Service level agreement compliance based on custom KPIs
Health and safety compliance, including planned v actual audits

Benefits for operations leaders
Link activity to output: See at a glance where your team’s effort is delivering financial results.
Act early: Address inefficiency, wastage, delays and rework issues as they happen, not after the event.
Manage resources efficiently: Use utilisation data to efficiently balance capacity and demand.
Improved board reports: Give the board, clear simple and trusted reporting that doesn’t just show activity, but also links directly to financials.
Take control of performance: Turn daily activity into predictable financial results.
Our Process

Step 1: Understand your KPIs
We work with you to understand what you want to report on and your current data sources

Step 2: Integrate and transform your data
We integrate the data from all your sources and transform it so it can be used to report on what matters to you, hosted in a dedicated data warehouse
Step 3: Build intuitive dashboards
We build you intuitive, cloud-based dashboards, giving you 24/7 access to clear insight and automated reporting

Daniel Dwyer, Group COO, Nirvana
The dashboards provide real-time insights into profitability. By leveraging this data, we can make informed decisions and improve overall business performance. If you're running a reactive maintenance business, Vizora is an absolute game-changer.
Don’t settle for incomplete dashboards or static reports
Get the clarity of a BI team and enterprise standard analytics – without the overhead.
Contact us
Email hello@vizora.com
Call on 01473 355810