FINANCE LEADERS
From month end packs to live and predictive reporting
We help finance teams link the numbers to what’s really happening in the business
Reporting challenges for finance leaders

Stuck producing manual reports instead of influencing strategy

Month end numbers tell you what happened, not what is coming

Operational data doesn’t connect to the P&L

Spreadsheets take hours to update and introduce risk
Use activity to predict future performance
Vizora gives you leading indicators today, to help you predict as you go. Finance can now flag risks and opportunities early and guide leadership to act faster.
| Activity you can measure | Outcomes you can predict |
| Operational activity per day / week | Turnover for the month |
| Capacity and utilisation % | Gross margin for the month |
| Customer satisfaction score | Recurring revenue |
| Discounts, rework and wastage | Gross margin reduction |
| Quote value and time to win | Future demand and capacity requirements |
| WIP to invoice time plus debtor days | Cashflow and cash pinch-points |
Finance dashboards with intuitive visuals

Month and YTD P&L v forecast with variance and drill-through detail
12 month P&L with actuals, forecast and variance against forecast
Balance sheet with current ratio and drill through detail
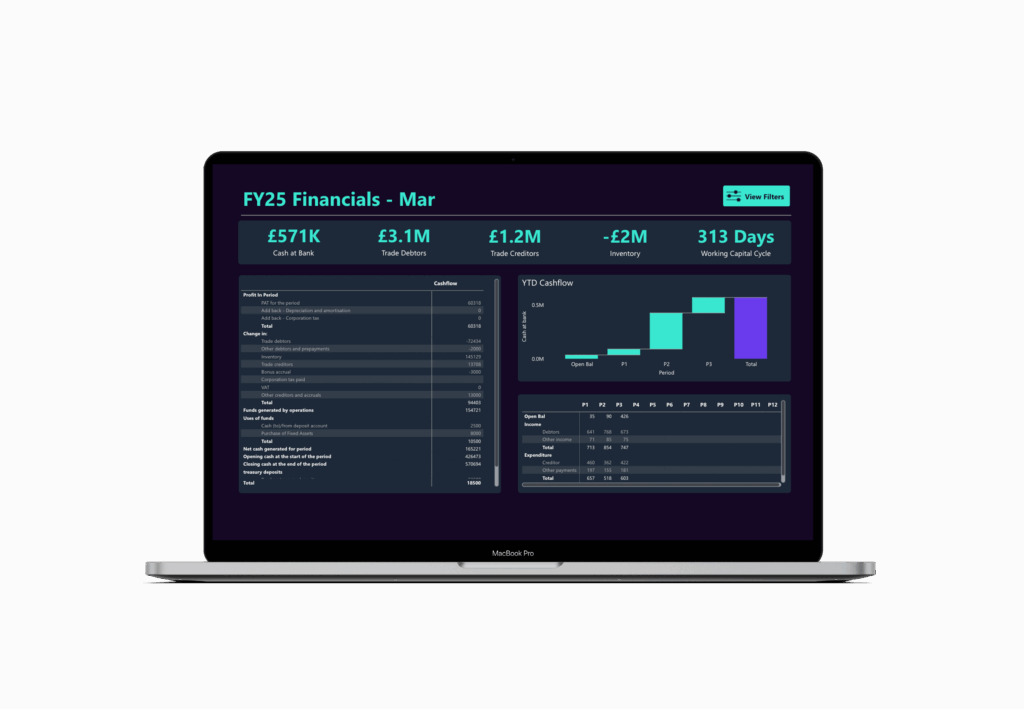
Cashflow forecast with period movements and working capital cycle
Aged debt profile by period

Real results for finance teams
How we helped Toppesfield, a national asphalt surfacing contractor save £60k per year
The challenge: Reporting was manual, slow and failed to capture contract level profitability quickly enough to take action. Finance team members were spending hours each week pulling data and updating manual spreadsheets.
The solution: Vizora integrated operations and finance data into one database and made it accessible from live dashboards.
The outcome: £60k/year saved in admin/reporting time costs, faster insight into contract margins.
Our Process

Step 1: Understand your KPIs
We work with you to understand what you want to report on and your current data sources

Step 2: Integrate and transform your data
We integrate the data from all your sources and transform it so it can be used to report on what matters to you, hosted in a dedicated data warehouse
Step 3: Build intuitive dashboards
We build you intuitive, cloud-based dashboards, giving you 24/7 access to clear insight and automated reporting

Mark Salmon, Finance Director, Toppesfield
We saved over £60k a year in time and admin cost by Vizora collecting and processing our data. The ability to make quick decisions, based on accurate dashboards is frankly invaluable. Vizora make the invisible visible across our business.

Benefits for finance leaders
Free up your time: Free time from manual reporting to focus on strategy.
Confidence in the numbers: Link finance to what’s really happening the business and build confidence in the numbers.
Get early warnings: Use operational activity to forecast outcomes daily and get early warnings on revenue and profit issues.
Improved board reports: Give the board, clear simple and trusted reporting that doesn’t just show the numbers, but also explains why.
Turn Finance into a growth driver: Stop reporting history, start shaping the future.
Don’t settle for incomplete dashboards or static reports
Get the clarity of a BI team and enterprise standard analytics – without the overhead.
Contact us
Email hello@vizora.com
Call on 01473 355810