Example Dashboards
A small set of clear pages beats a hundred charts. Here are typical views our clients adopt first, with drill-downs for detail when needed.
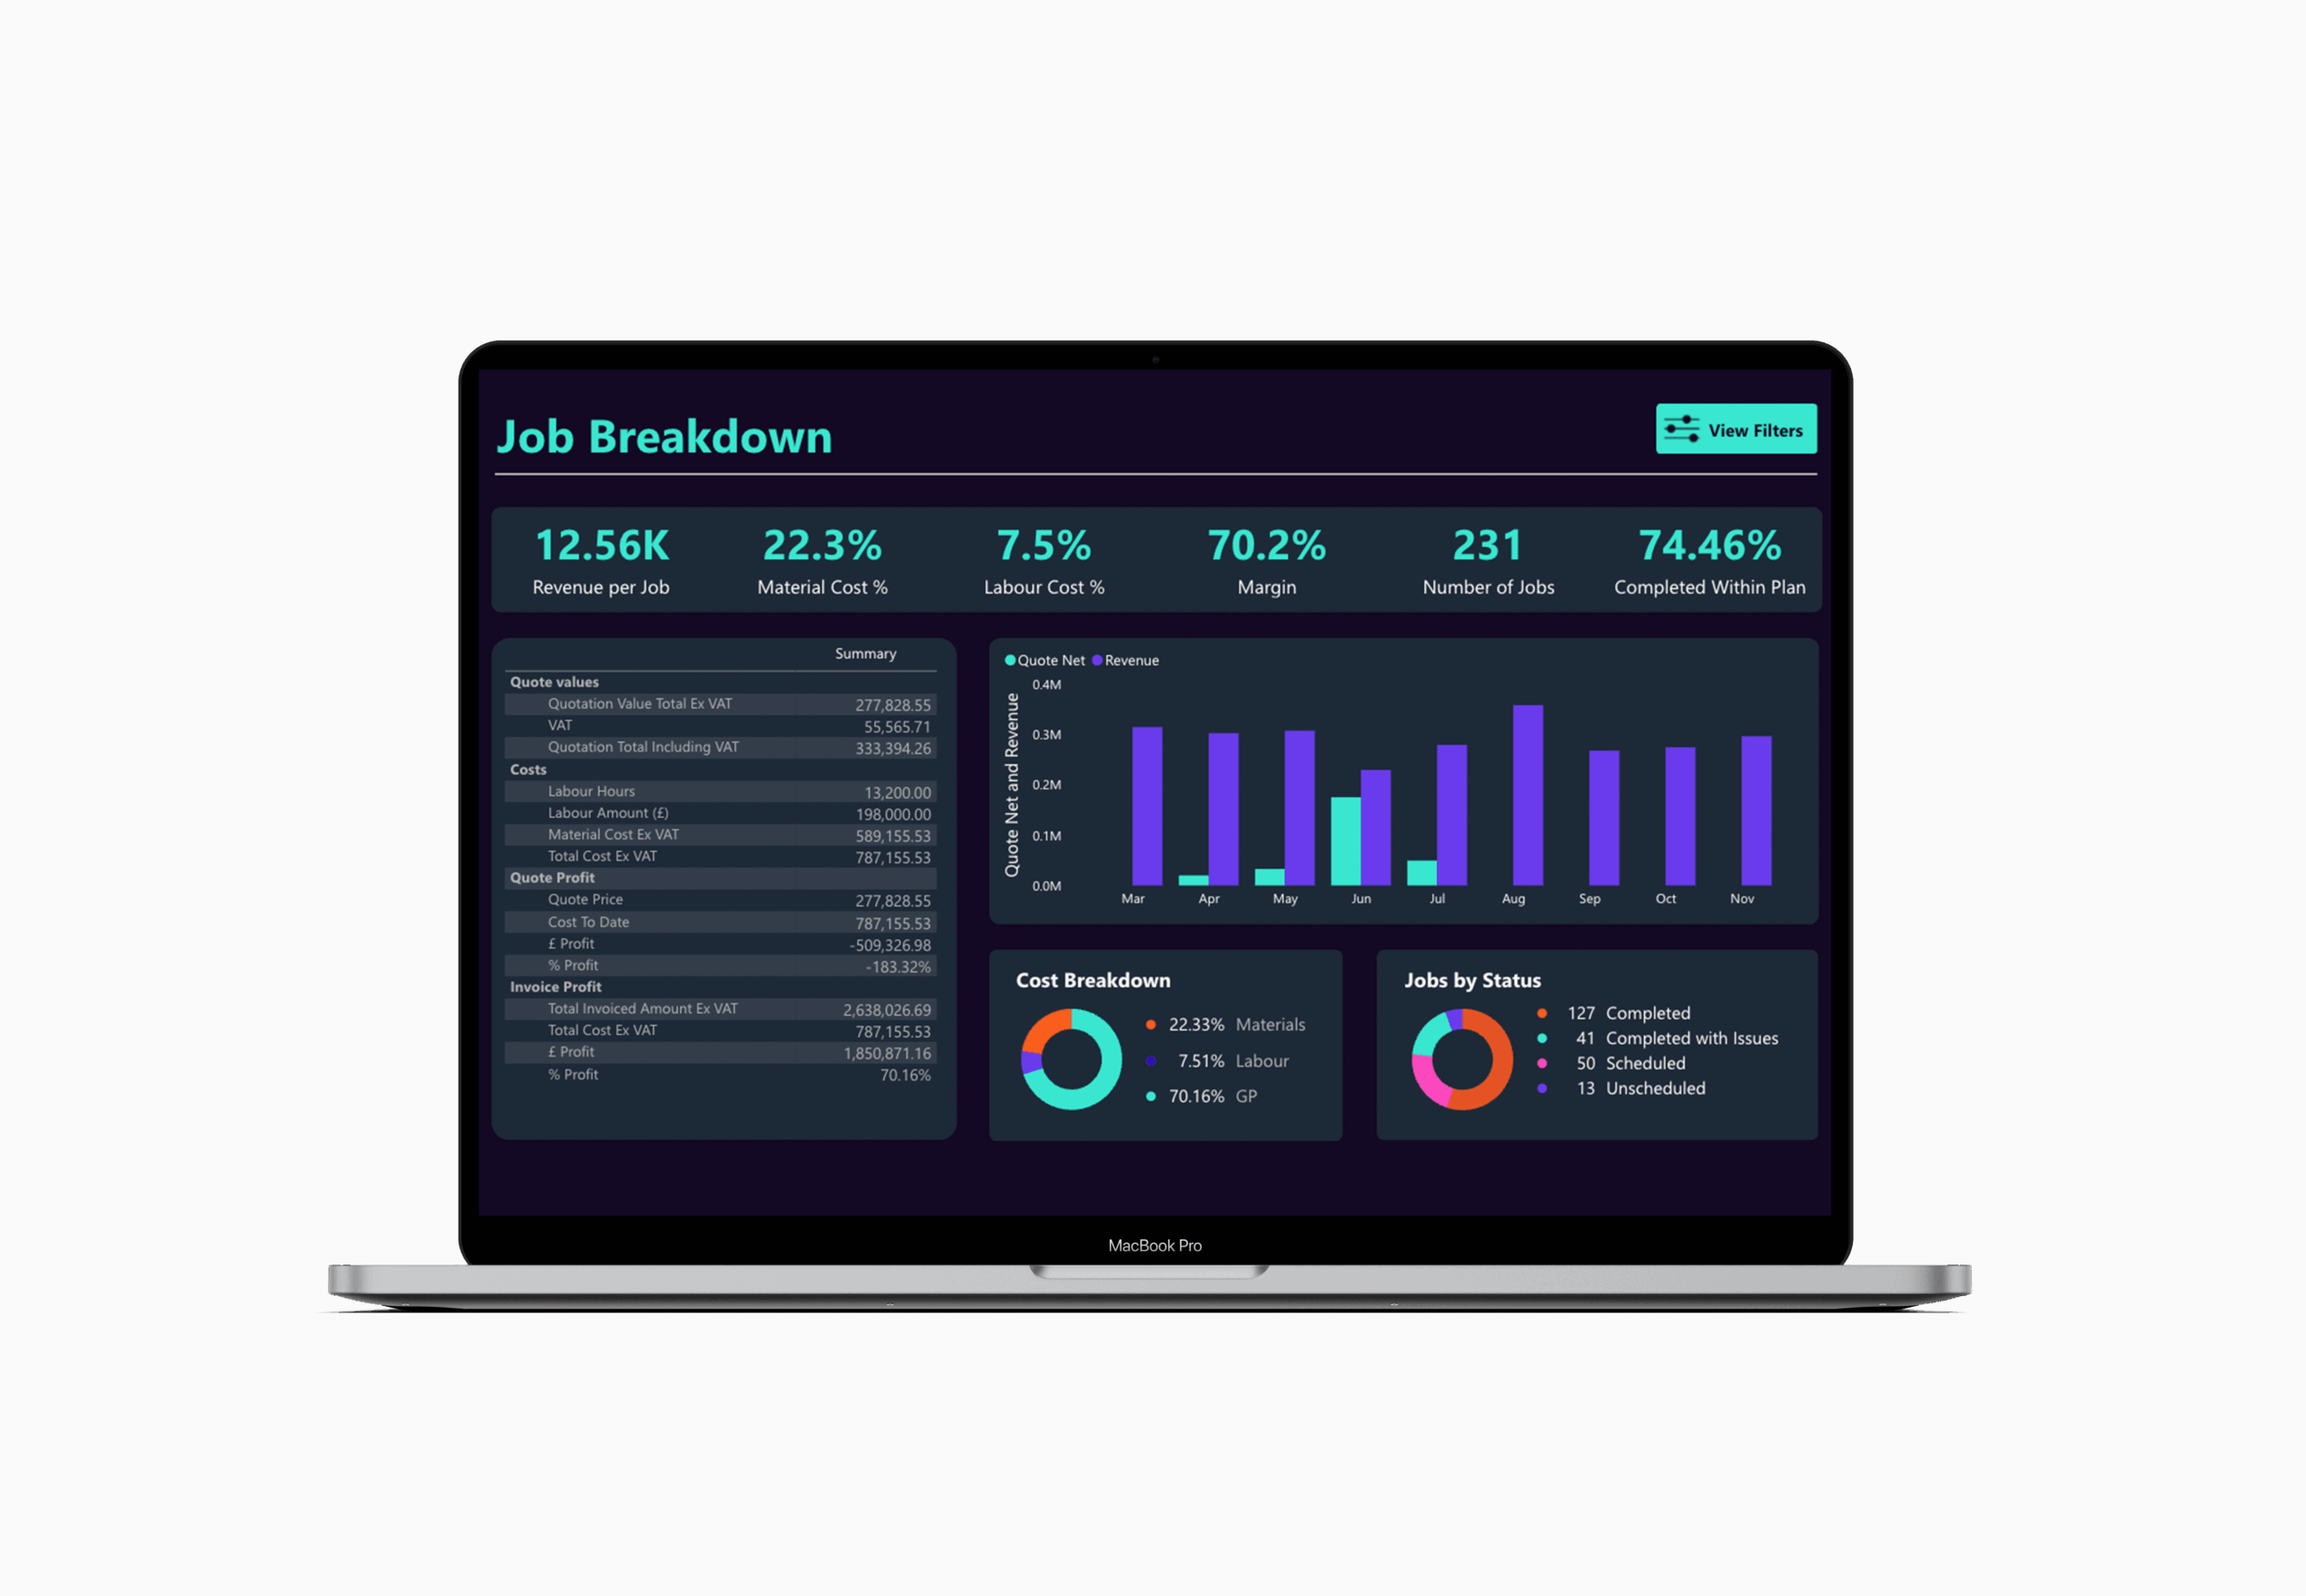
Contract or project profitability
Big Question: where do we really make money?
Shows: margin by client and contract or project with profit leakage signals
Drill-downs: labour, subcontractors, materials and unbilled extras
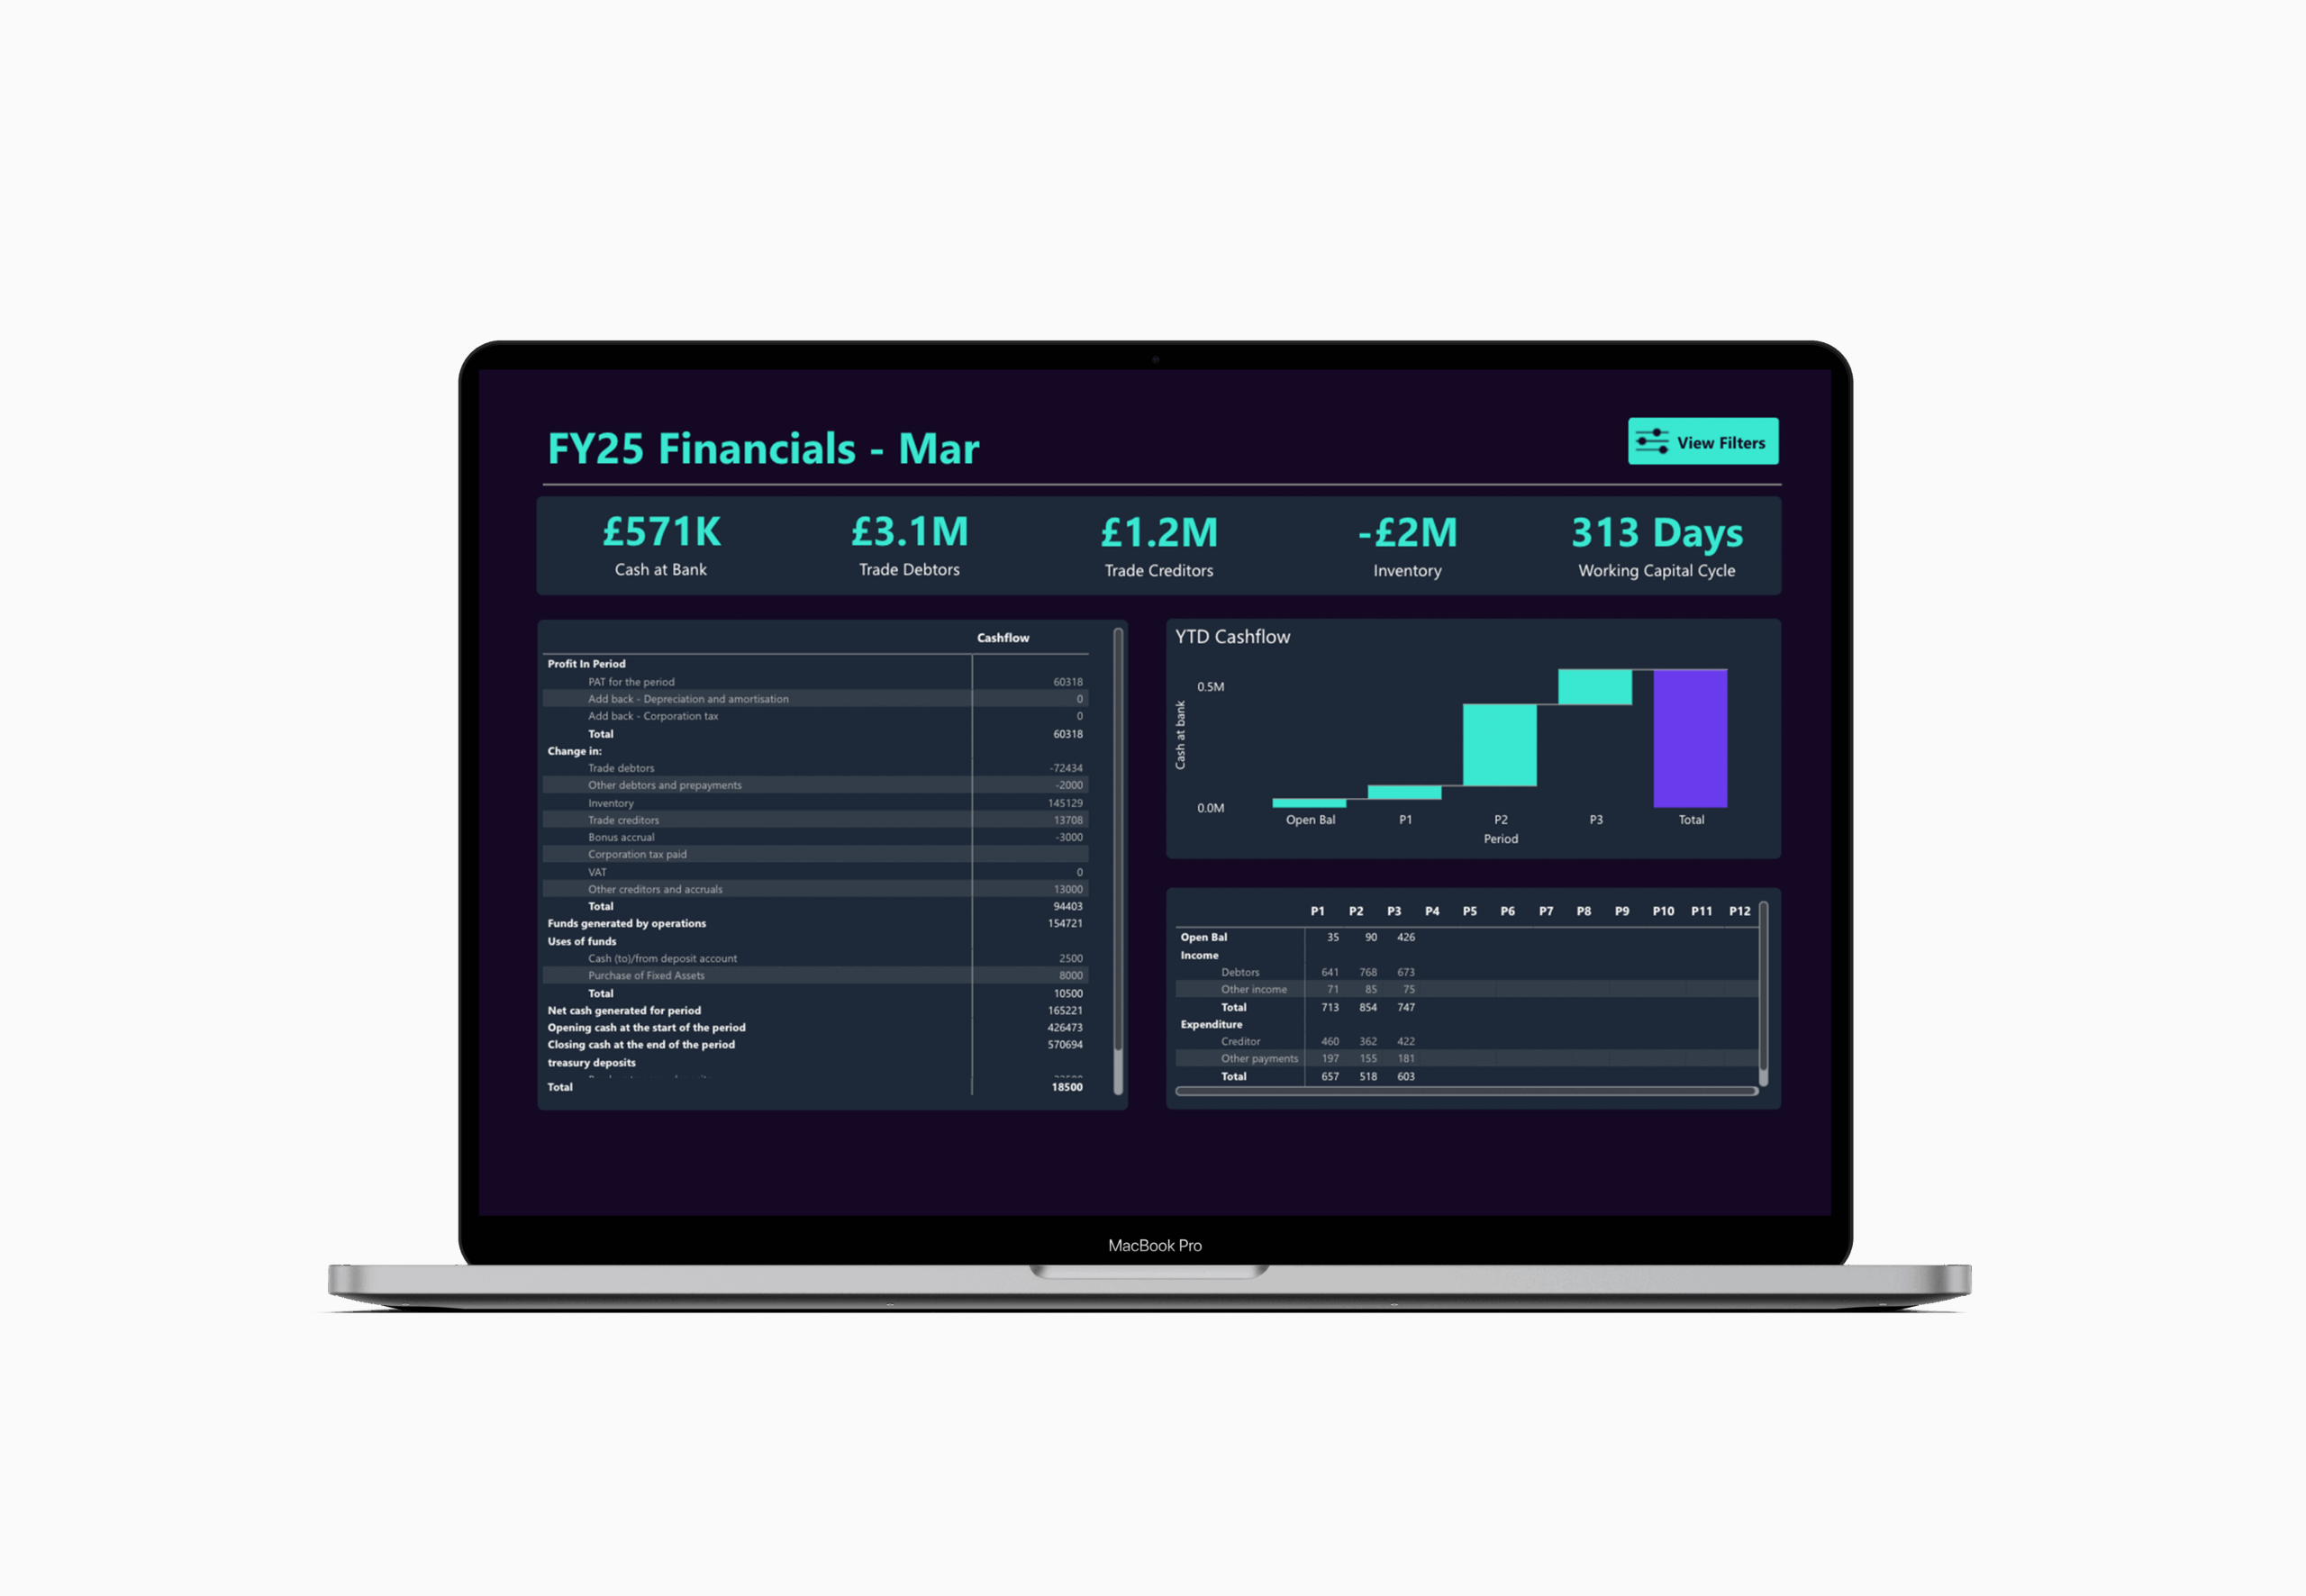
Cashflow
Big Question: how quickly do we turn work into cash?
Shows: work done to invoiced to paid, WIP ageing, overdue items and risks
Drill-downs: client, contract, team and age band
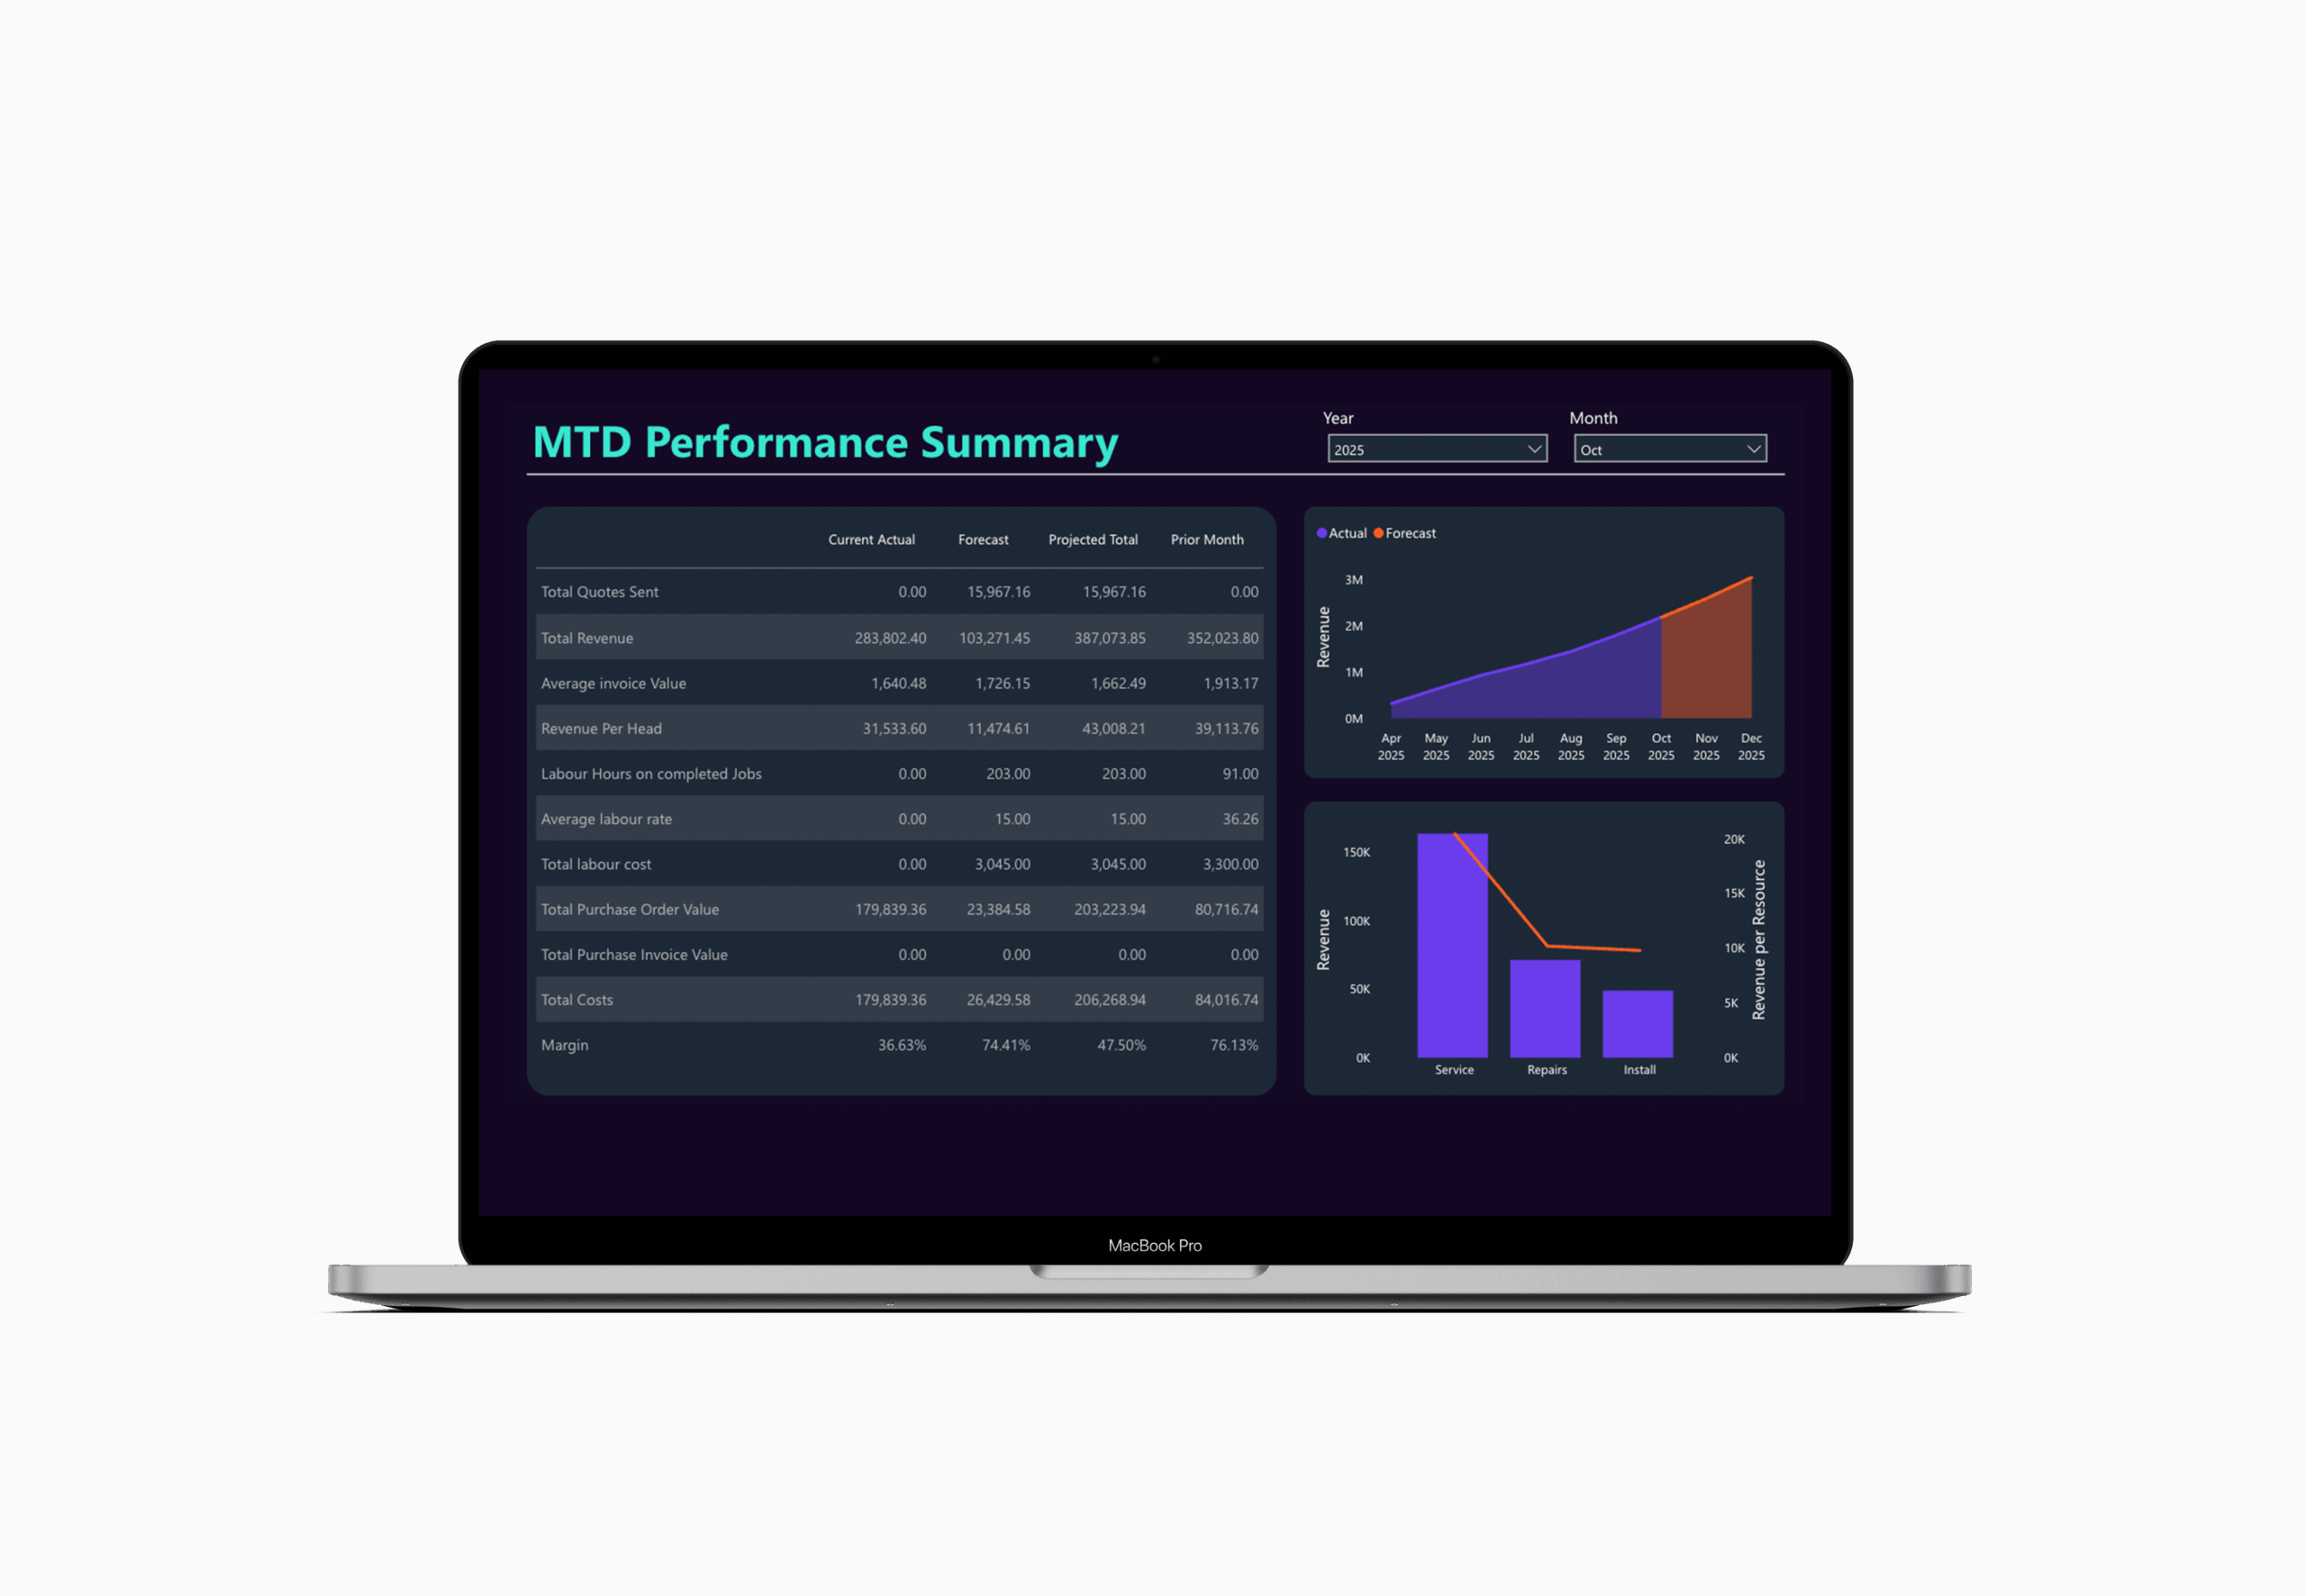
Mid-month revenue forecast
Big Question: are we likely to hit this month’s numbers?
Shows: throughput and volume mapped to a mid-month forecast
Drill-downs: job type, contract, team and region
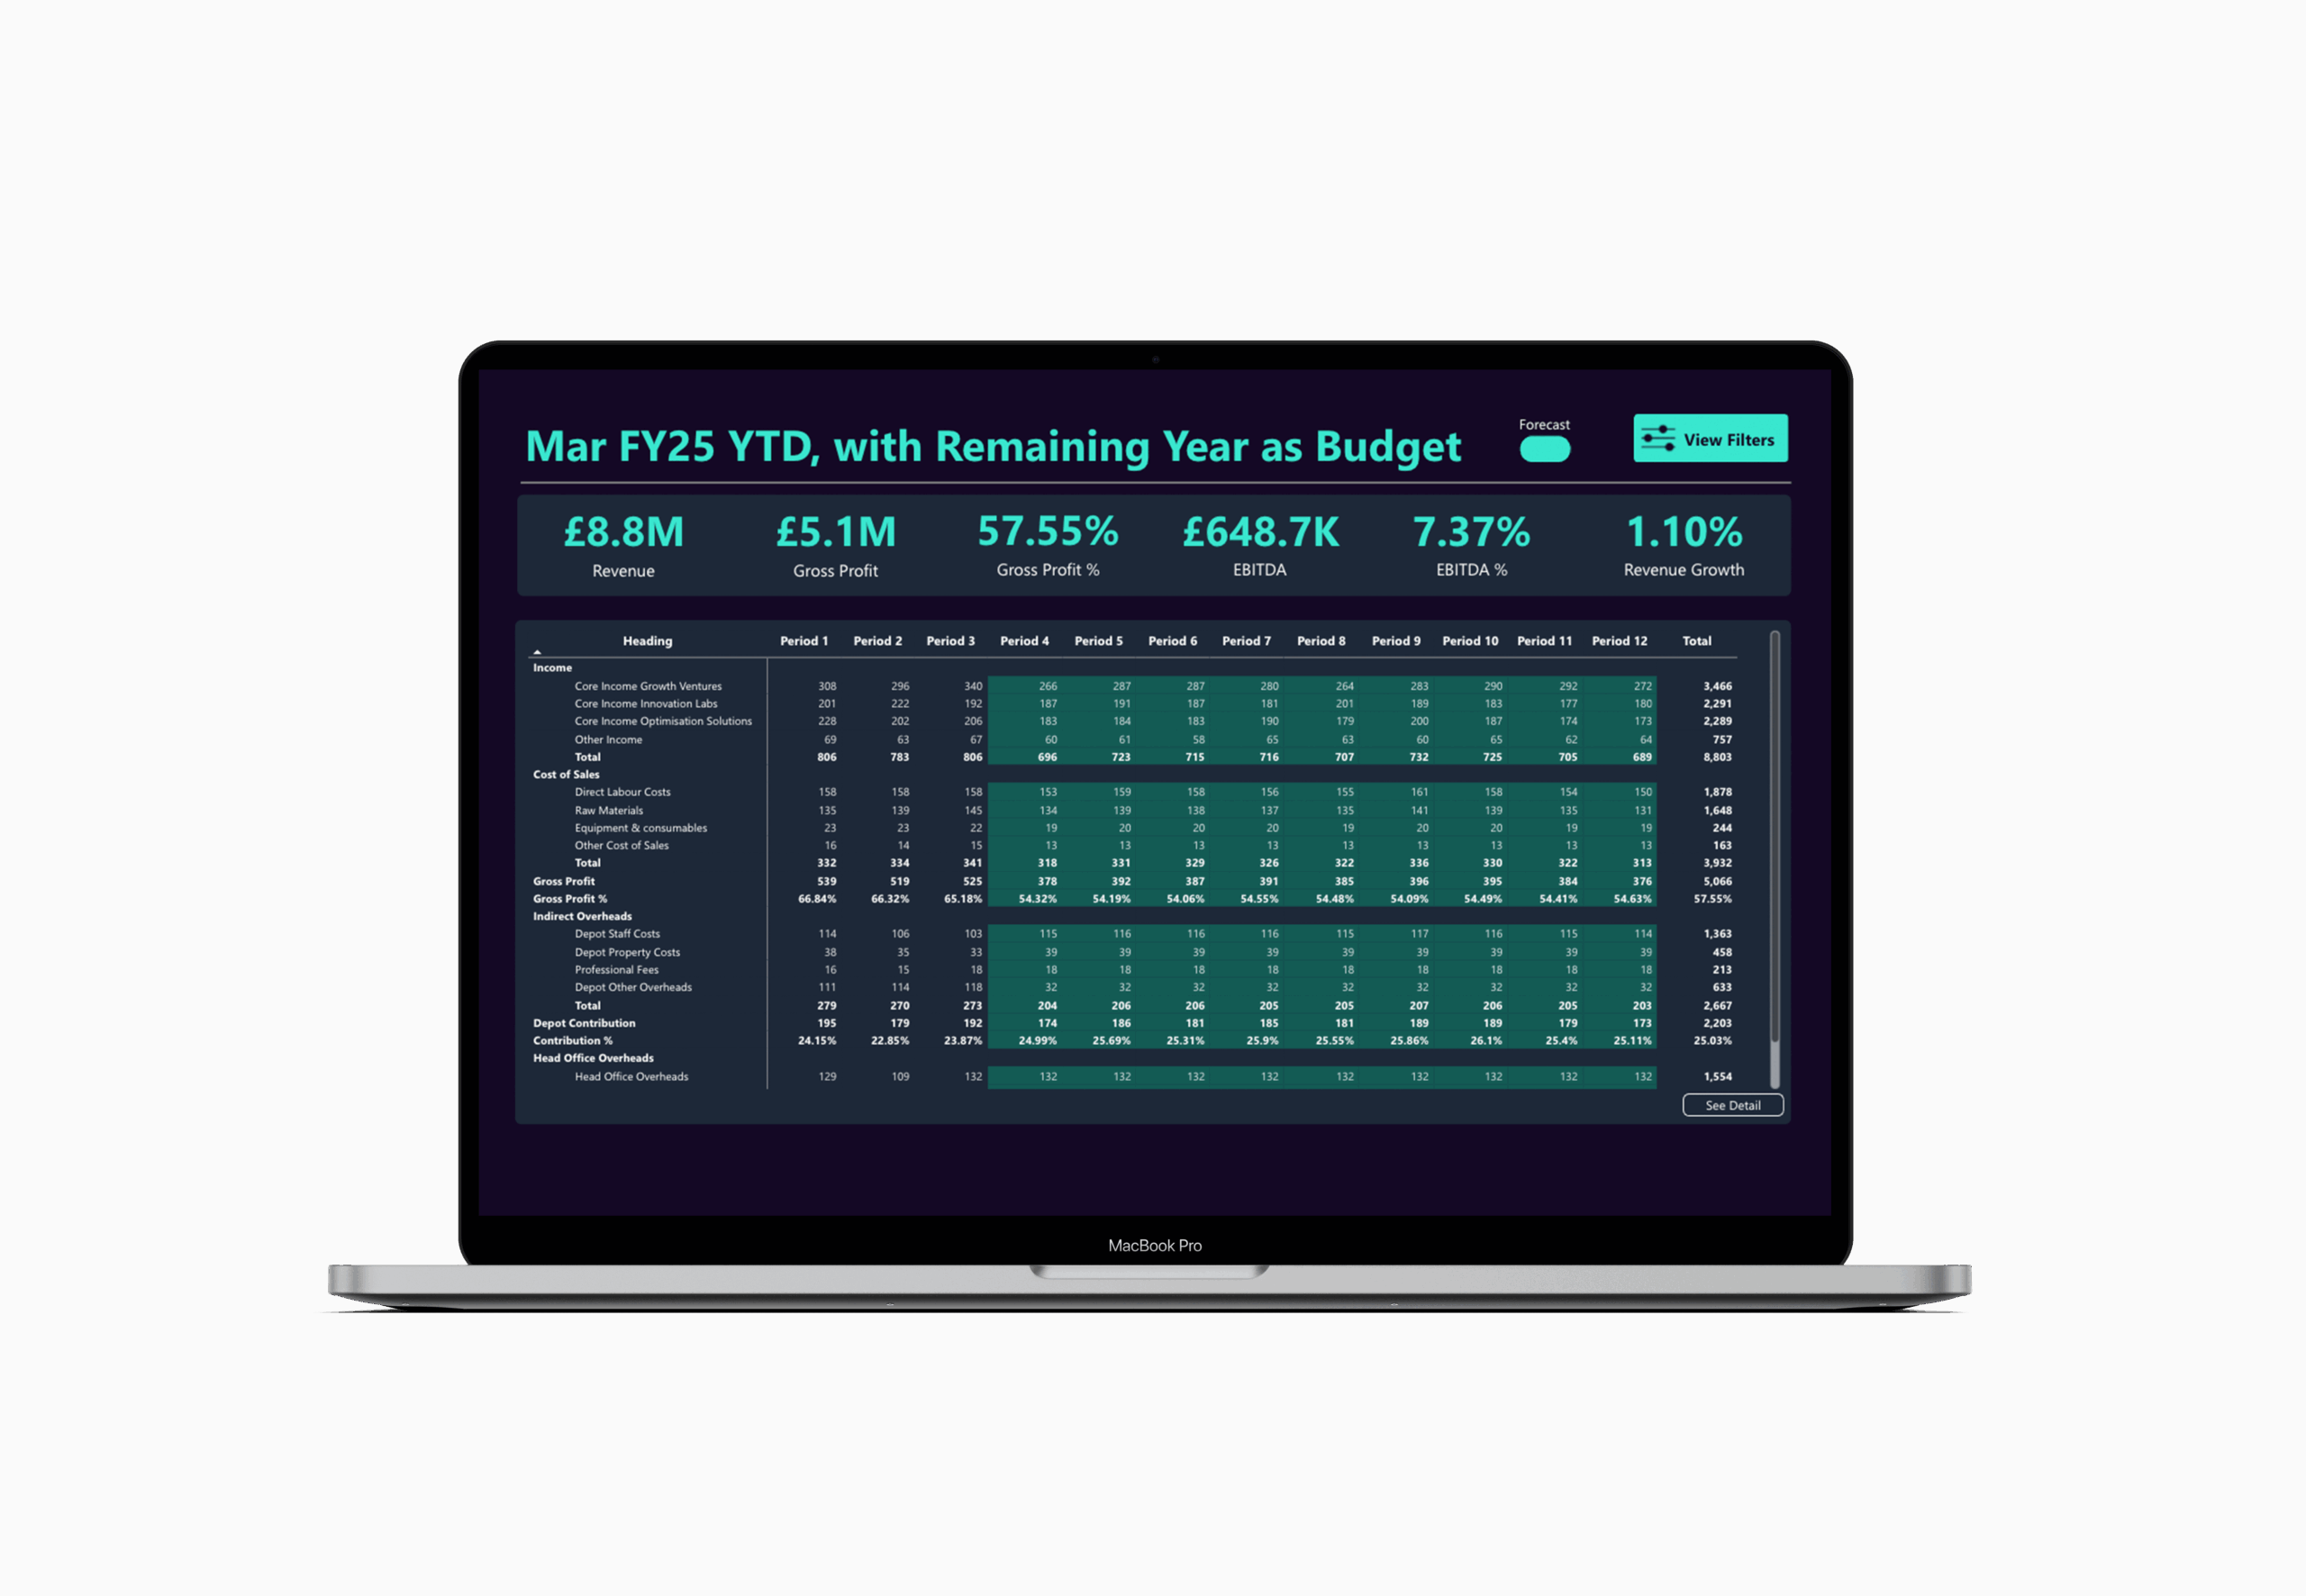
12-month Profit and Loss
Big Question: how are we performing against our 12-month budget?
Shows: YTD performance, run-rate, forecast out-turn
Drill-downs: individual invoice detail, individual cost detail
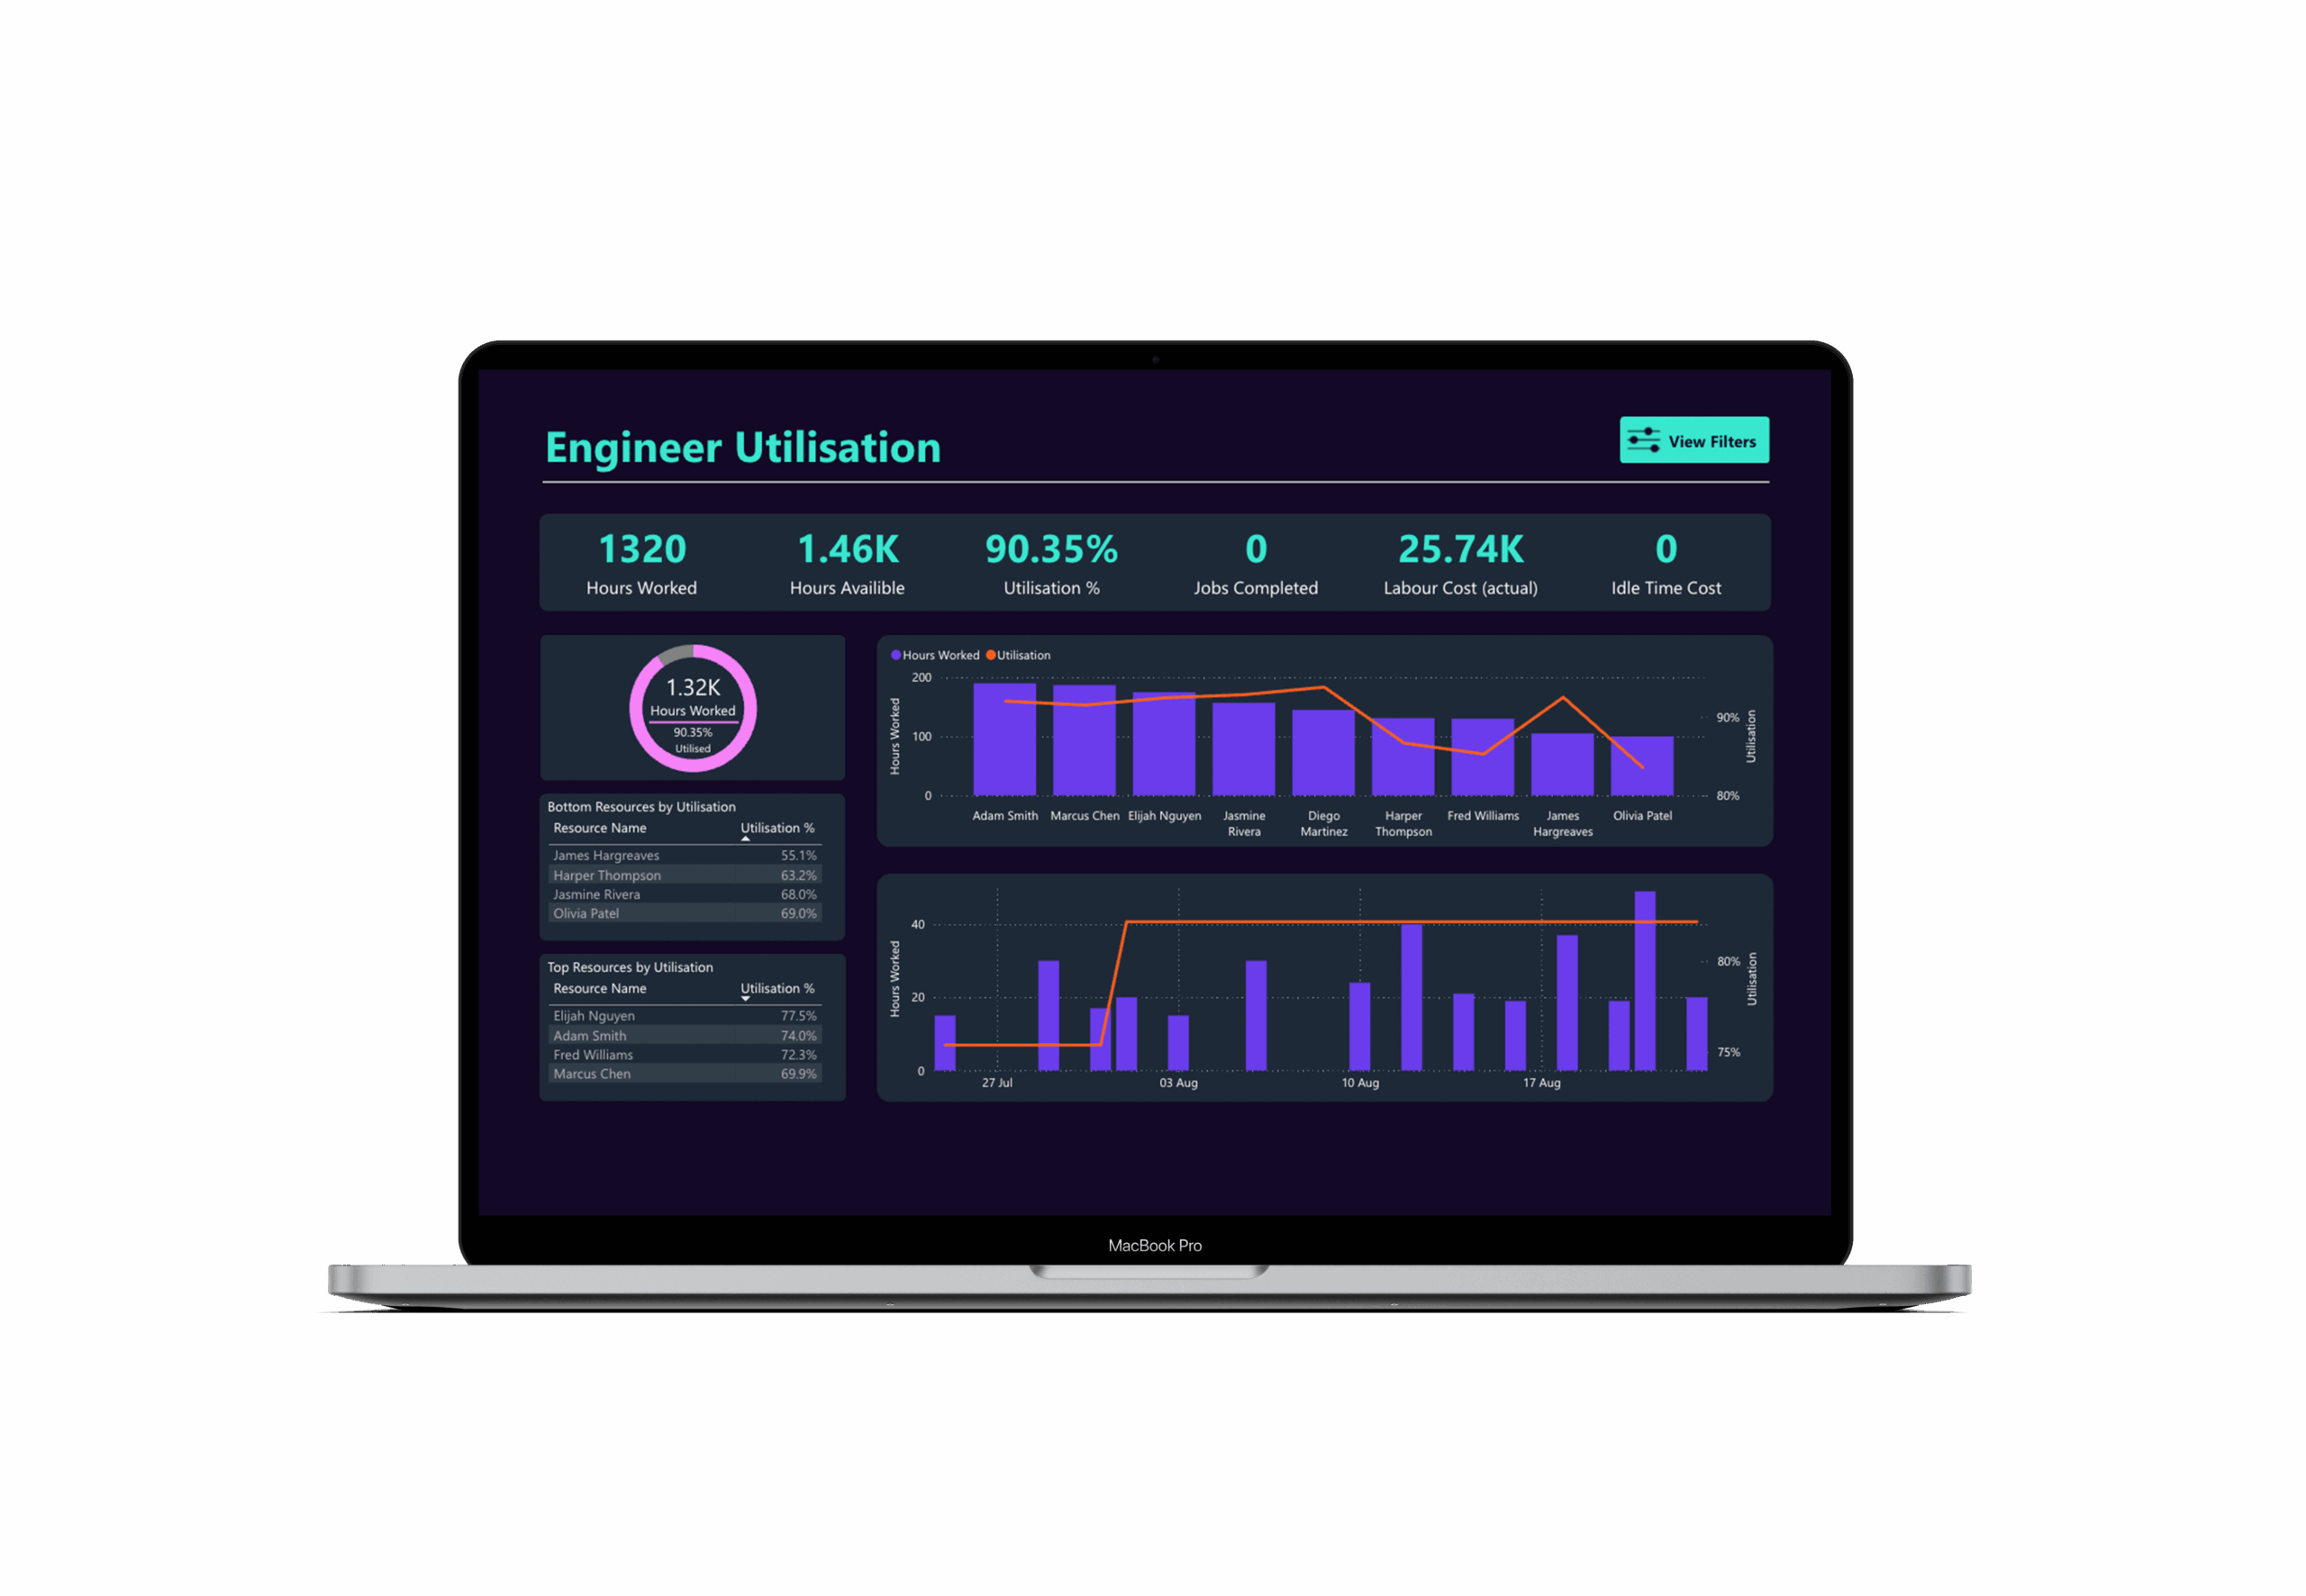
Field service engineer utilisation
Big Question: is our workforce fully utilised?
Shows: hours worked versus utilisation for individual engineers
Don’t settle for incomplete dashboards or static reports
Get the clarity of a BI team and enterprise standard analytics – without the overhead.
Contact us
Email hello@vizora.com
Call on 01473 355810